Market Update - October 2022
Welcome to the October edition of the Market Update
Key Points
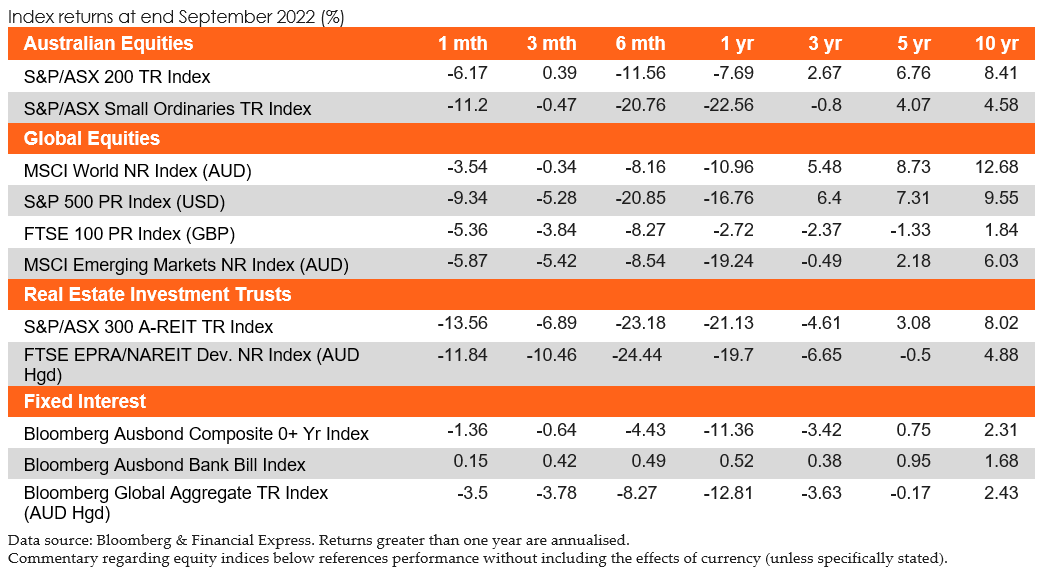
· Australia’s S&P/ASX 200 Index finished September materially lower by -6.2%. All sectors finished negative, the steepest falls seen in Utilities (-13.8%), Property (-13.6%), and Information Technology (-10.6%).
· The US markets experienced sharp falls during the month with the S&P 500 Index (USD) finishing the month lower by -9.2%. European markets were not immune from the sell-off with the FTSE Eurotop 100 Index down by -5.6%.
· Asia’s Hang Seng Index (HKD) experienced one of the steepest declines in world markets finishing down by -13.2%.
Australian equities
The Australian share market finished September with the S&P/ASX 200 Accumulation Index finishing sharply lower by 6.2% with all sectors finishing negatively. The Utilities (-13.8%) and Properties (-13.6%) sectors were the largest fallers, as every sector was affected by the broad-market sell-off in response to various negative catalysts.
The month of September was defined by substantial volatility within all segments of the market, as the global macroeconomic outlook continued to deteriorate amidst elevated CPI figures and surging bong yields. In particular, investors continued to grapple with geopolitical uncertainty, increasing recessionary fears and major European economic volatility. Ultimately, the prospect of peak interest rate projections and worsening economic outlook led all sectors down. However, the Property and Utilities sectors were the worst performers given the interest rate sensitivity that is inherent within these sectors. Moreover, Information Technology finished substantially lower as ‘growth’ assets were led downwards by major central banks indicating that policy rates will rise as high as necessary to curb ’sticky’ inflation.
In September, Equal Weight (-9.30%) and Enhanced Value (-8.87%) led all factors downwards. Over the past quarter, Momentum (+6.13%) and Growth (+1.27%) have been the best performing factors. Further, over the past 12 months all factors finished negatively.
Global equities
Global markets continued their descent over the month of September in the wake of hawkish central banks and the potential escalation of the Ukrainian conflict. Developed markets fell by -3.2%, with Global small caps underperforming their large cap counterparts posting a -4.2% loss by month end. Emerging and Asian markets did not fare as well as their Developed market peers, returning -5.9% and -6.8% respectively.
Investor confidence remains extraordinarily low as the recession narrative received support from financial turmoil abroad in the UK. Momentum and High Dividend Yield factors were the top performers for the month returning -6.0% and -6.4% respectively, whilst Growth and Quality were the laggards returning -8.6% and -8.7% respectively according to MSCI ACWI Single Factor Indices reported in local currency terms.
Property
Local and Global REITs sold off during September. Domestically, the A-REITs index (represented by the S&P/ASX 200 A-REIT Accumulation Index) ended the month -13.6% lower, providing the worst monthly performance since 2020. The index has returned –21.5% on a total return basis year-to-date to 30 September. Global REITs outperformed the local REITs index, albeit still experiencing a drawdown of –11.7% during the month. Domestically, infrastructure (represented by the S&P/ASX Infrastructure Index) has followed the trend in A-REITs, returning –12.6% in September bringing year-to-date performance down to 0.1%.
The Australian residential property market experienced a –1.4% change month on month represented by Core Logic’s five capital city aggregate. Sydney (-1.8%), Brisbane (-1.7%) and Melbourne (-1.1%) were the worst performers. Adelaide (-0.2%) and Perth (-0.4%) stayed relatively neutral.
Fixed income
Following back-to-back monthly rate hikes, September again brought hawkish central bank signalling and rising recession fears. The RBA has maintained its aggressive tightening schedule, raising rates by 50bps in its September meeting, bringing the cash rate to 2.35%. Correspondingly, the Australian bond market, as measured by the Bloomberg AusBond Composite 0+ Yr Index, fell 1.4%. Over the course of the month, Australian Government 2 Year Bond yields steadily increased by 33bps, and Australian Government 10 Year Bond yields increased by 29bps.
Globally, we continue to see similar aggressive monetary tightening. The Federal Reserve increased the target for the federal funds rate by another 75bps, bringing the target rate range to 3.0-3.25%. Resultingly, US 10 Year Treasury yields increase by 63 bps, while US 90 Day T-Bills remained steady throughout the month. In the UK, the Government’s fiscal stimulus and the Bank of England’s 50bps rate hike resulted in a fall in the pound and a surge in bond yields.
REITs (listed property securities)
Local and Global REITs sold off during September. Domestically, the A-REITs index (represented by the S&P/ASX 200 A-REIT Accumulation Index) ended the month -13.6% lower, providing the worst monthly performance since 2020. The index has returned –21.5% on a total return basis year-to-date to 30 September. Global REITs outperformed the local REITs index, albeit still experiencing a drawdown of –11.7% during the month. Domestically, infrastructure (represented by the S&P/ASX Infrastructure Index) has followed the trend in A-REITs, returning –12.6% in September bringing year-to-date performance down to 0.1%. The Australian residential property market experienced a –1.4% change month on month represented by Core Logic’s five capital city aggregate. Sydney (-1.8%), Brisbane (-1.7%) and Melbourne (-1.1%) were the worst performers. Adelaide (-0.2%) and Perth (-0.4%) stayed relatively neutral.
Alternatives
Preliminary estimates for September indicate that the index decreased by 0.2 per cent (on a monthly average basis) in SDR terms, after decreasing by 6.9 per cent in August (revised). The non-rural and base metals sub- indices decreased in the month, while the rural sub-index increased. In Australian dollar terms, the index increased by 2.1 per cent in September.
Over the past year, the index has increased by 30.6 per cent in SDR terms, led by higher LNG, coking coal and thermal coal prices. The index has increased by 30.0 per cent in Australian dollar terms.
Key Points
· The OECD revised its global growth forecast for 2023 to 2.2%, down from 2.8% in its June report, as global energy and inflation crises continue to be a drag.
· The RBA raised interest rates by 50 bps in September, bringing the cash rate to 2.35%.
· The European Central Bank raised interest rates by 75bps as the annual inflation rate reached 10%.
Australia
The RBA raised rates by 50 bps in September, bringing the cash rate to 2.35% in a bid to bring inflation down.
The unemployment rate rose to 3.5% in August, above the expected 3.4%. Retail sales rose 0.6% in August, bringing the annual rate to 19.2%
The Westpac-Melbourne Institute Index of Consumer Sentiment unexpectedly rose 3.9% to 84.4 in September, rising for the first time since November 2021.
The NAB Business Survey for August rose 3 points to 10, with initial concerns about the impact of rising interest rates easing. The S&P Global Composite PMI rose to 50.9 in September.
The trade surplus narrowed to $8.21 billion in August, below forecasts of $10.1 billion surplus, amid strengthening domestic demand and rising energy prices.
Global
The OECD revised its global growth forecast for 2023 to 2.2%, down from 2.8% in its June report, as global energy and inflation crises continue to be a drag on economies. The major forecasts from the report are:
· A drop in growth in the eurozone from 3.1% this year to only 0.3% in 2023, with many countries in the 19-member currency bloc will spend at least part of the year in recession.
· The recovery in China next year will be weaker than expected at 4.7%, as Beijing wrestles with a property market and banking sector weighed down by huge debts.
· The USA economy will slow from 1.5% growth this year to only 0.5% next year, spending part of 2023 in recession.
US
The Federal Reserve raised interest rates by 0.75% to the 3-3.25% range in its September meeting, pushing borrowing costs to the highest since 2008. It is the third straight time the Federal Reserve has raised rates 75 basis points, as it rapidly reduces liquidity to the financial markets to help tamp down soaring inflation.
Inflation rose 0.1% in August, above the expected 0.1% drop but the annual rate eased for the second straight month to 8.3%.
Non-farm payrolls came in at 263,000 for September, 13,000 less than expected and 52,000 less than the August result. The unemployment rate stood at 3.5% in September, 20bps below expectations and the August figure. Personal incomes grew 0.3% in August, in line with market expectations.
Consumer sentiment rose to 58.6 in September, below the anticipated 59.5. Retail sales were increased 0.3% in August above forecasts of a flat reading, with the annual rate growing 9.1%.
The S&P Global Composite PMI rose to 49.5% in September pointing to a much smaller contraction in private sector activity than in the previous month (44.6). PPI fell 0.1% in August, in line with forecasts as the annual rate dropped to 8.7%%, slightly below the anticipated 8.8%.
The trade deficit narrowed by US $67.4 billion for August, slightly less than expected and less than the $70.5 billion prior deficit.
Europe
The European Central Bank raised interest rates by 75bps in September, in line with market expectations. It also flagged ongoing rate rises as it significantly revised up its inflation expectations for the next three years.
The annual inflation rate in the Euro area jumped to 10% in September, above the anticipated 9.7% with prices showing no signs of peaking.
Consumer confidence fell by 3.8 points to -28.8 in September, which is in line with expectations. Retail sales fell 0.3% in August, a third consecutive monthly decline, in a sign high inflation is weighing on consumers’ affordability. Annual retail sales fell 2.0% in August, below market expectations of -1.7%.
Unemployment came was unchanged in August at 6.6%, in line with market expectations.
The S&P Global Composite PMI fell to 48.1 in September extending the downturn into a third straight month and pointing to the fastest decline in output since January 2021.
PPI rose 5.0% in August, slightly above forecasts, while the annual rate rose to 43.3% on the back of soaring energy prices.
The German government announced €200m relief package to protect companies and households from the impact of soaring energy prices.UK
The Bank of England raised interest rates by 0.5% to 2.25% in its September meeting, pushing borrowing costs to the highest levels since 2008.
Inflation rose 0.5% in August, below, the 0.6% expected, with the annual inflation rate unexpectedly dropping to 9.9%. The government announced new retail energy price support measures, including an Energy Price Guarantee, which is hoped to limit further increases in inflation.
The unemployment rate fell to 3.6% in June, below the market forecast of 3.8% Consumer confidence fell to -49 in September as British households continued to grapple with the cost of living crisis and wider economic uncertainties. Retail sales came dropped 1.6% in August, against, bringing the annual rate to -5.4%. Both were down on market forecasts of -0.5% and -4.2% respectively.
The composite PMI index came in at 49.1in September, with a sizeable downturn in manufacturing production while the services sector stalled.
The GBP fell against the USD to an all-time low in late September following an announcement of proposed sweeping tax cuts, and subsequently caused UK bond yields to reach their highest level since the global financial crisis.
PPI dropped 0.10% in August with the annual rate rising 16.1%.
China
China’s annual inflation rate unexpectedly fell to 2.5% in August, below the market forecast of 2.8% as prices eased amid strict regional COVID curbs and adverse weather.
The unemployment rate was lower in July at 5.3%, within the government target range, following continued governments efforts to spur economic recovery.
The Caixin Manufacturing PMI unexpectedly fell to 48.1 in September amid the impact of COVID controls in key regions.
Retail sales dropped 0.05% in August, with the annual rate growing by 5.4%, well above the market estimate of 3.5%, as consumption strengthened following further relaxation of COVID curbs.
Asia Region
The Bank of Japan maintained its key short-term interest rate at -0.1% and that for 10-year bond yields around 0% during its September meeting.
Inflation came in at 0.3% in August, down from 0.4% in July, bringing the annual rate to 3.0%. This is the highest level since September 2014 on the back or rising food and raw materials as well as weakness in the yen.
The unemployment rate dropped to 2.5% in August, matching forecasts.
The consumer confidence index in Japan came in at 30.8 in September, below market expectations, amid lingering global economic uncertainty
Retail sales Retail Sales in Japan increased 1.4 % in August, well about the expected 0.6%, with the annual rate rising 4.1%, exceeding the 2.8% market expectation. Overall household spending fell by 1.7% in August, 300bps below expectations and after a 1.4% decline in July with the annual rate increasing by 5.1%.
The Composite PMI increased to 51.0 in September, signalling a return to expansion across the Japanese private sector, with services activity growing the most in three months on the back of a further loosening of COVID restrictions.
The Japanese Government announced that solo tourists would be allowed back into the country from 11 October.
Currencies
The Australian Dollar closed the month of September lower than it started, as a drop in key commodity prices lent their hand to steep losses in the domestic currency (month-on-month). In trade-weighted terms, the AUD fell 2.8% to 61.5.
Common themes continued to play out across key regions with inflation, energy prices and overall economic stability front of mind. Most notably, proposals to slash the 45% income tax rate in the United Kingdom (to be funded by Government borrowing) were met with fierce backlash from investors, sending the British Pound (GBP) through the floor. The Central Bank of England was then forced to intervene in the bond market as a spike in yields forced pension funds to scramble for cash to meet collateral requirements. Despite this, the GBP managed to claw back some ground and finish the month stronger than the AUD after a stellar August month for the local currency.
A similar story was shared for the Japanese Yen (JPY) and the Euro (EUR) as the AUD looked to catch its breath. The US Dollar (USD) was the clear winner in September, posting a 6.9% gain. The AUD remains 15.3%, 4.8% and 7% stronger (year-on-year) against the JPY, EUR, and GBP, respectively, and 11.3% weaker (year-on-year) than the USD.
Disclaimer: This document is for the exclusive use of the person to whom it is provided by Lonsec and must not be used or relied upon by any other person. No representation, warranty or undertaking is given or made in relation to the accuracy or completeness of the information presented in this document, which is drawn from public information not verified by Lonsec. Financial conclusions, ratings and advice are reasonably held at the time of completion but subject to change without notice. Lonsec assumes no obligation to update this document following publication. Except for any liability which cannot be excluded, Lonsec, its directors, officers, employees and agents disclaim all liability for any error or inaccuracy in, misstatement or omission from, this document or any loss or damage suffered by the reader or any other person as a consequence of relying upon it. Copyright © 2022 Lonsec Research Pty Ltd (ABN 11 151 658 561, AFSL No. 421445) (Lonsec). This report is subject to copyright of Lonsec. Except for the temporary copy held in a computer's cache and a single permanent copy for your personal reference or other than as permitted under the Copyright Act 1968 (Cth), no part of this report may, in any form or by any means (electronic, mechanical, micro-copying, photocopying, recording or otherwise), be reproduced, stored or transmitted without the prior written permission of Lonsec. This report may also contain third party supplied material that is subject to copyright. Any such material is the intellectual property of that third party or its content providers. The same restrictions applying above to Lonsec copyrighted material, applies to such third party content.